
Optimize your logistics carbon footprint
Real-time CO2 insights across routes, transport modes, and supply chains, powered by Qubics.

What it does
Carbon Intelligence Qubic calculates and analyzes emissions across your logistics operations.
-

CO2 per shipment
Precise emissions calculation for every delivery
-

Emissions by route
Compare transport modes and pathways
-

Comparison alternatives
Analyze multiple routing options
-

Real-time data integration
Recalculated on every request
Emissions data that changes the routing
-
Reduce emissions without increasing costs
Find the optimal balance between sustainability and budget
-
Compare routes based on CO2 impact
See carbon footprint alongside cost and time
-

Meet ESG and regulatory requirements
Stay compliant with evolving environmental standards
-

Provide transparency to clients and partners
Build trust with data-driven sustainability reporting
How it works
Real-time carbon intelligence integrated directly into your logistics decisions
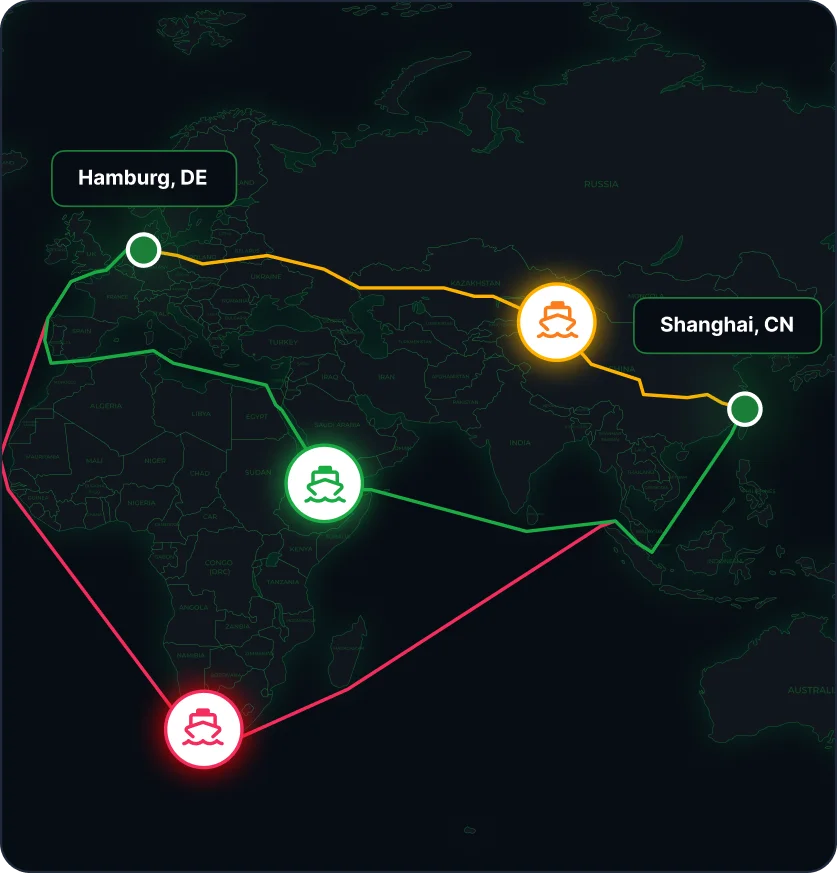
🔥 CO2 vs Cost in practice
CO2 tracks how efficiently your logistics runs, so it moves with cost and transit time rather than sitting in a separate report.
-
Option A: Fast delivery
15.2 t / $8,500 Best Option
Transit time: 20 days
-
Option B: Balanced route
11.8 t / $7,200 Lower CO2
Transit time: 26 days
-
Option C: Lowest cost
19.4 t / $6,100 Highest CO2
Transit time: 31 days
Shanghai, CN → Hamburg, DE
-

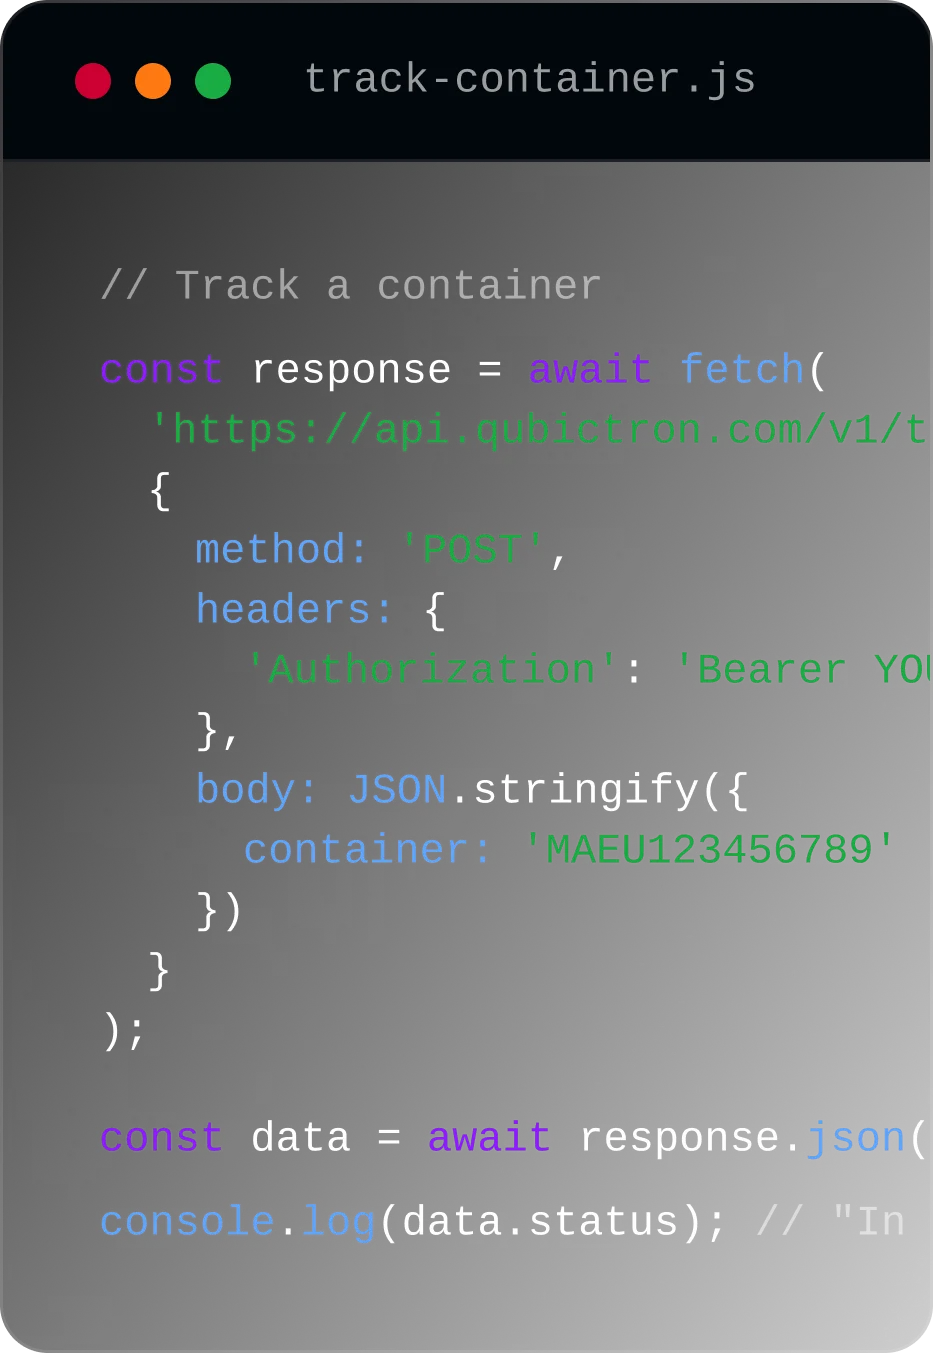
Connect your data
Integrate with your existing systems via API

-

Select routes
Choose shipments or routes to analyze
-

Get CO2 insights
Real-time emissions across all options
-

Optimize decisions
Balance CO2, cost, and time factors
A decision layer,
not a calculator
-

Integrated into your system
Embedded directly into your platform, with no separate tool to open
-

Live at the time of the call
Figures come from current vessel, route and load conditions
-

API-first for automation
Built to run at volume inside your own stack
-

Scalable across global operations
Works for single shipments or enterprise fleets
Key drivers of CO2 emissions in shipping
-

Route efficiency
Optimized routes reduce distance, delays, and fuel consumption.
-

Vessel efficiency
Newer and optimized vessels produce lower emissions
-
Vessel speed
Lower speeds significantly reduce emissions.
-
Capacity utilization
Higher load reduces CO2 per container.
Why integrate CO2 calculation into your product?
Win the deals that ask for carbon figures, and cut fuel spend while you do it.
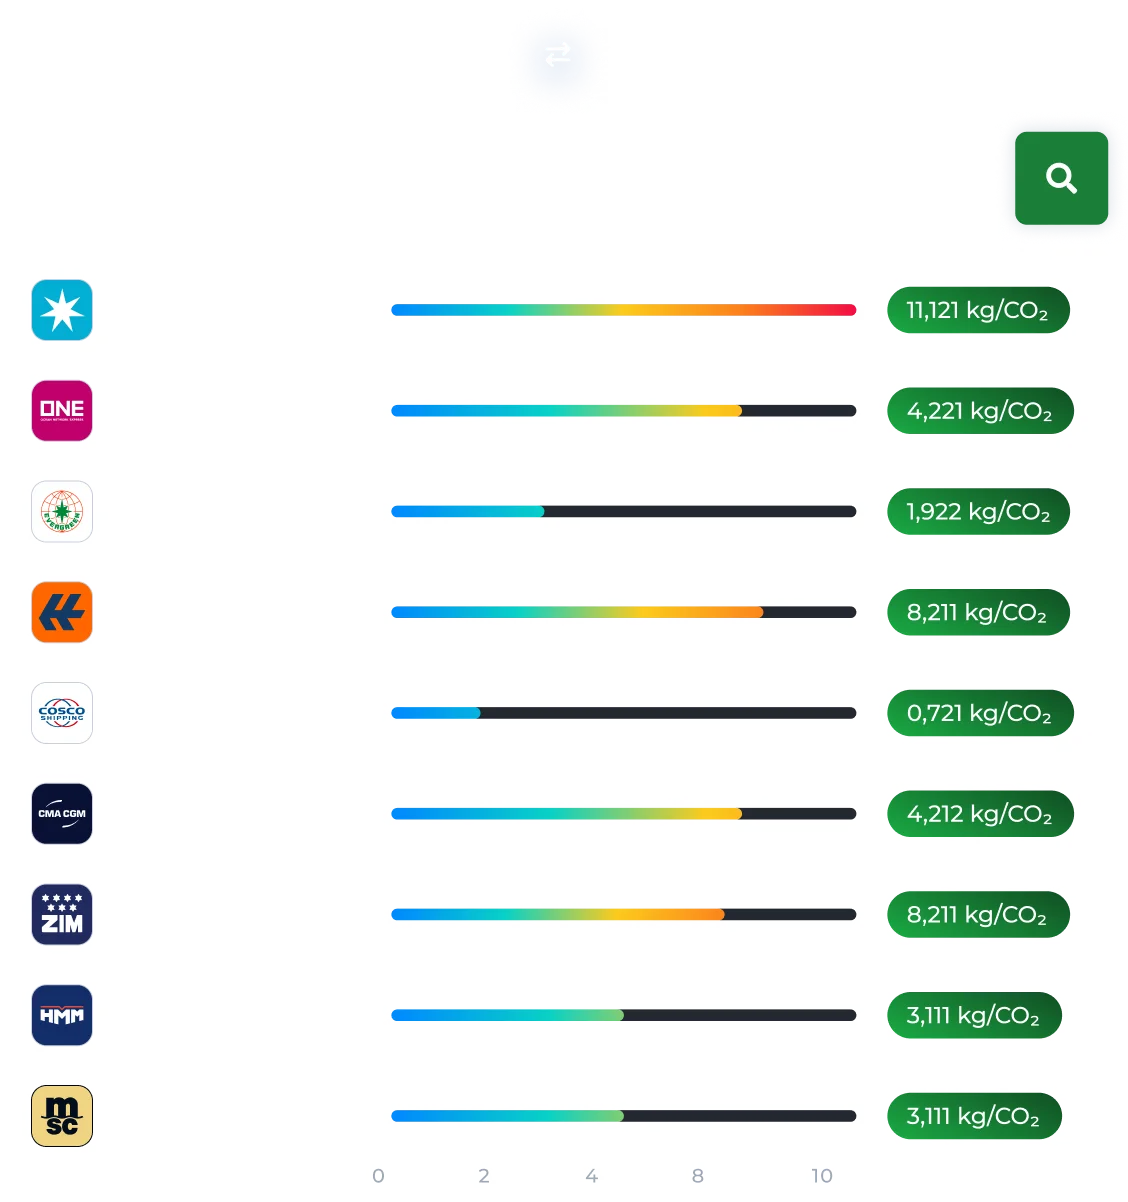
Shipping Lines Comparison Based on CO2 Emissions
-
Win more clients
Provide transparency and sustainable options that build trust and increase conversions.
-

Reduce operational costs
Optimize routes, fuel usage, and efficiency to lower both emissions and expenses.
-
Stay competitive and compliant
Meet growing customer expectations and regulatory requirements to access larger deals.
Start optimizing
your logistics emissions
Request access or integrate via API